

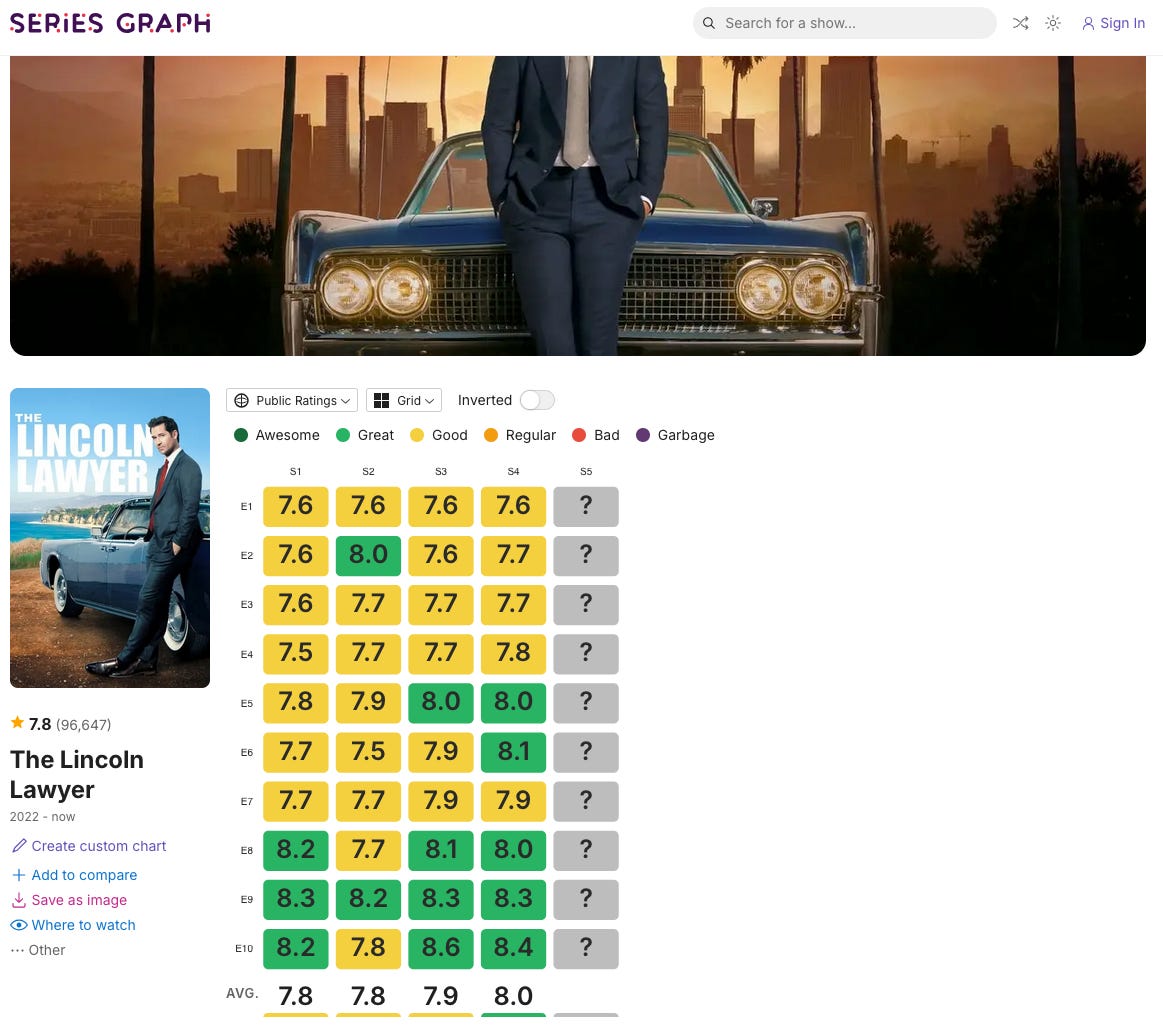
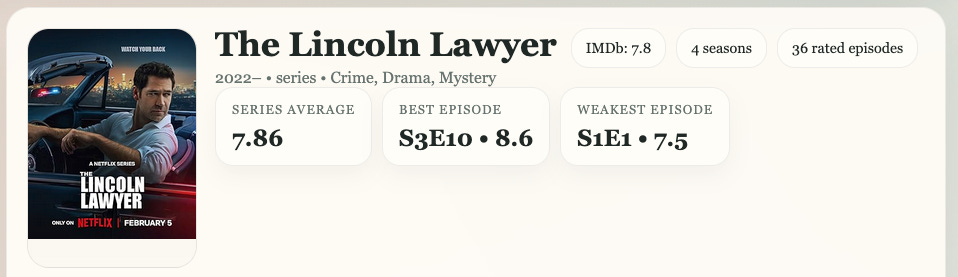
I was watching the TV show The Lincoln Lawyer a few weeks ago, and after a particularly good episode, I wondered what IMDB rating it had received compared to other episodes in the series. I went to the Series Graph website that I shared with you all previously to see the comparison. Here’s what the Series Graph site looks like for The Lincoln Lawyer:
Then I wondered how hard it would be to make my own site that would do the same thing as Series Graph.
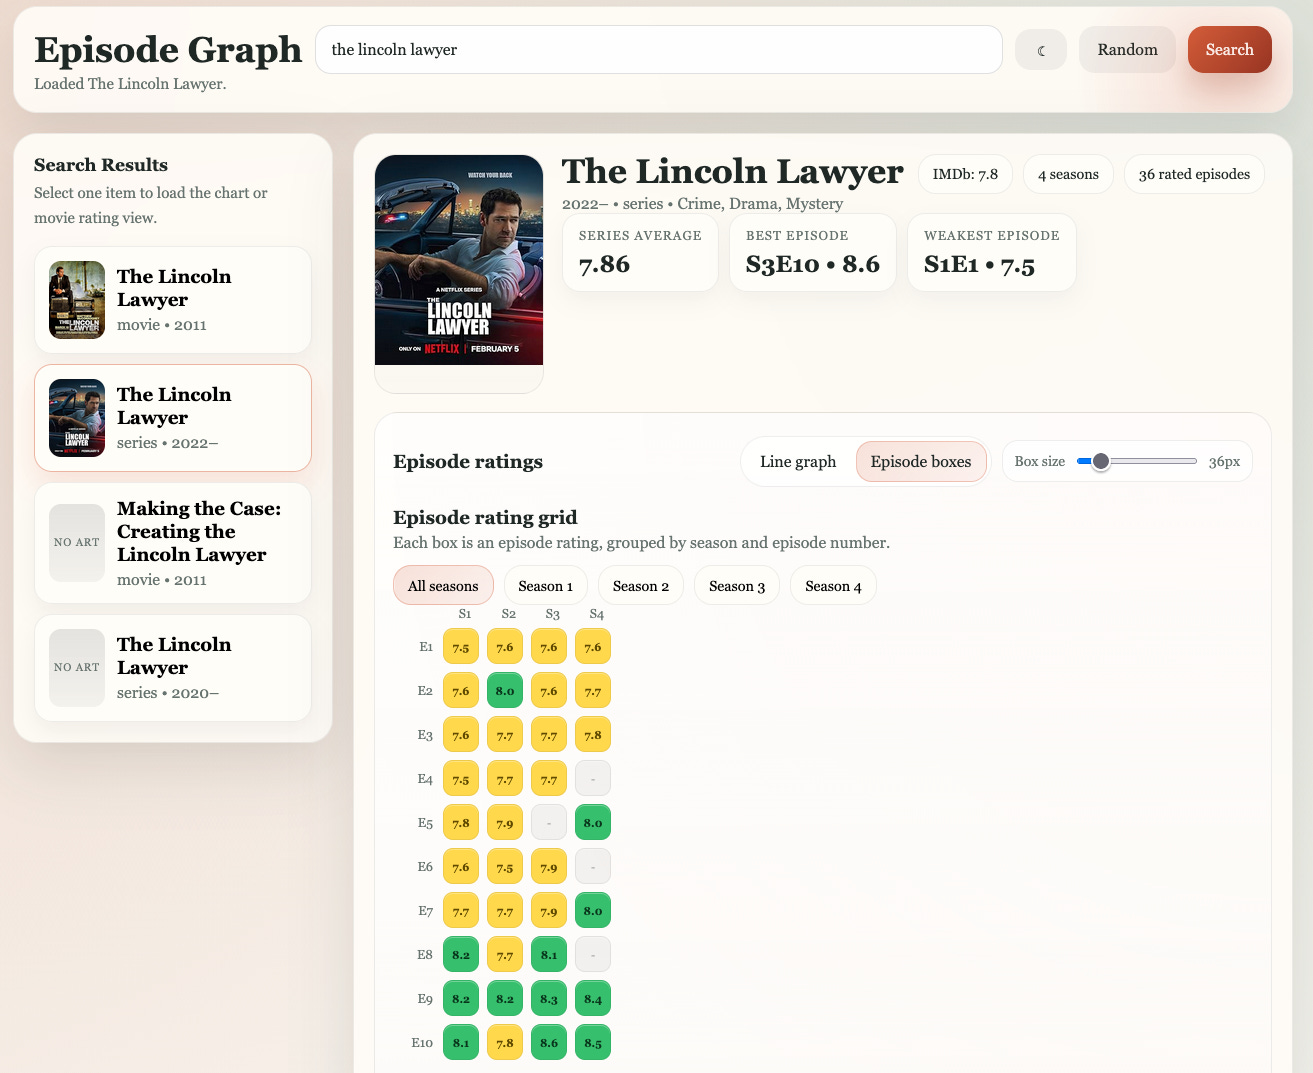
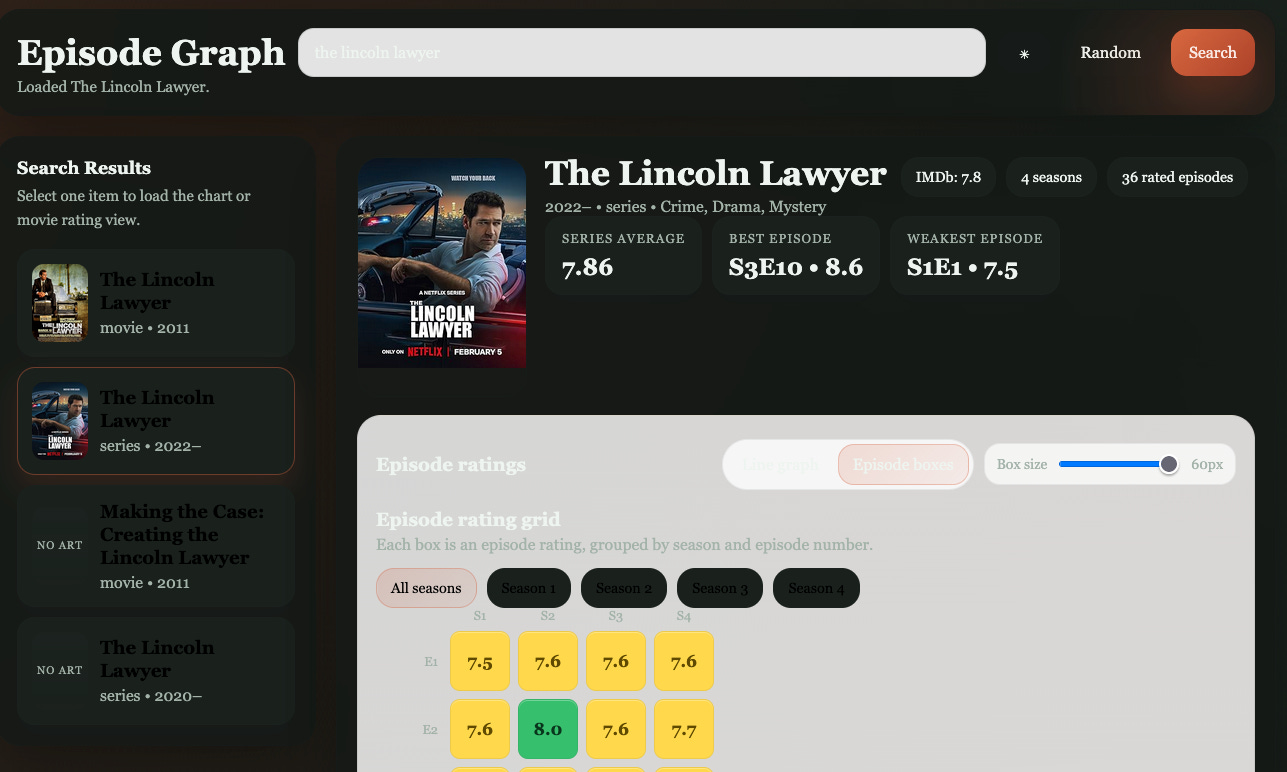
What I found was that it was both easier and harder than I thought it would be. Here’s what my site, Episode Graph, looks like:
If you just want to go to my site and don’t care at all how I made it, go here and skip the rest of this post.
But, I’ll tell you up front that there are some issues with my site, so don’t plan to use it as a substitute for Series Graph. Here are the limitations of my site:
My site has trouble getting information for certain TV episodes, so some ratings will be missing. This could be rectified if I paid money for a proper API feed (more on that later).
The “dark mode” colors aren’t right, making that mode difficult to read. To change it to “light mode,” click on the asterisk/moon icon to the right of the search bar.
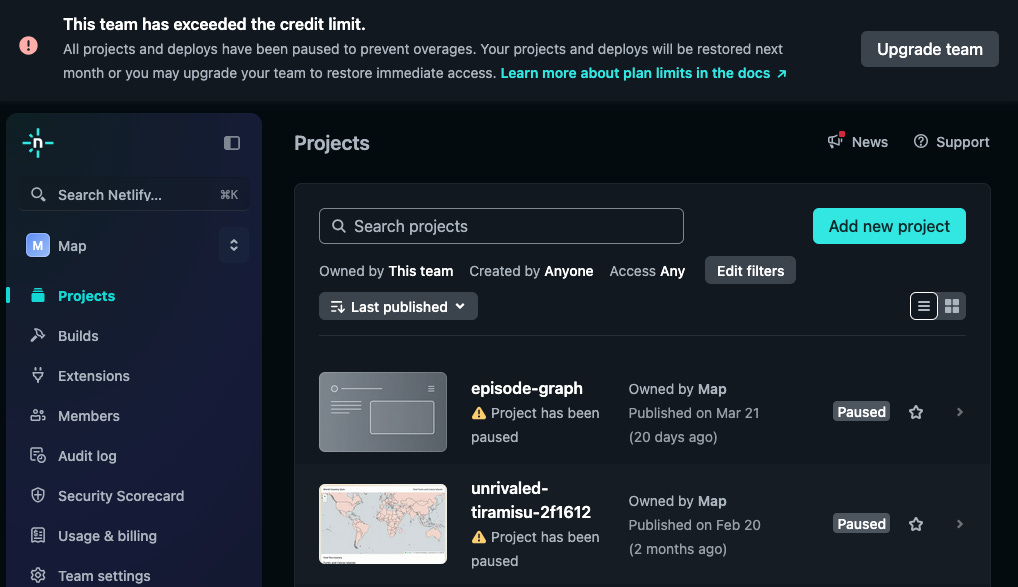
My site may stop working. I actually wrote this post weeks ago, but I had used up all my “credit” from my free Netlify account (read more about how I use Netlify here) and had to wait until a new billing cycle kicked off for the site to become active again. My free account came with 300 credits, the next level up costs $9 per month and gives you 1,000 credits per month. I want to try to keep all of this at the free level, so I didn’t upgrade. I’ll be honest, I didn’t know how many credits I was eating up each time I uploaded a change to my site, though I do know that it took quite a few iterations to get the site I have now. Either way, when I exceed my free credits, all sites I’ve created on Netlify (to include my Olympics spinner and geography game) stop working until the next month, as you can see below.
How I made my site
I went to Claude’s Codex and typed in this prompt:
ok, i want you to make an html site that allows me to look up tv series or movies and see the imdb ratings of each episode (or movie) in graphic form similar to the Series Graph app/website. can you do that?
Codex said it could do this, but that I’d need to get access to an API and would need to upload files to Github.
I vaguely knew what these two things were, so after some back-and-forth with Codex, I was given background and instructions.
APIs
API stands for Application Programming Interface. In plain English, it is a set of rules that says: 1) what you can ask a system to do, 2) how to ask it, and 3) what kind of answer you will get back.
From Claude:
Websites use APIs by sending requests to external services and receiving data back in a structured format (usually JSON), which they then display to users.
For example, when a website shows weather, maps, or login options, it sends a request like “get current weather for this location” to another service’s API, receives the data, and uses it to update the page in real time.
Think of an API as a request for data from another organization that stores that data. For instance, if you wanted the latest stock prices, you’d sign up for an API to get stock prices from an organization that track them, like Bloomberg. If you wanted hotel pricing and availability data, you might sign up for an API from Expedia. Or, if you wanted to get weather data, you might sign up for an API from Weather.com.
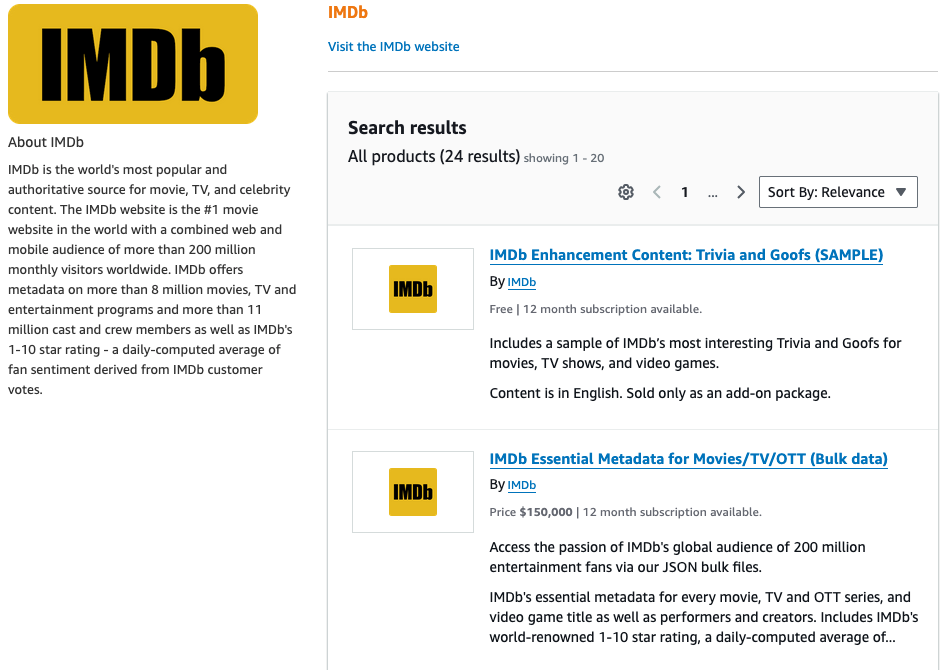
You get the idea—basically anyone out there who has information on the web will likely offer you the ability to sign up for an API to get their data. Some agencies offer their data for free, like the government, and others require you to pay for the data—IMDB falls into this latter category, charging $150,000 per year. Obviously movie data is a big business!
I did not have an extra $150K lying around, so I asked Codex what other options were available, and we settled on The Open Movie Database (OMDb) API, which was free for a limited number of queries.
Unfortunately, I quickly used up my allotted queries in building my site and playing with it, so for now I pay $1 per month to get unlimited queries but limited data (as I later learned).
GitHub
GitHub is a website and platform for storing, managing and collaborating on code. Codex originally wanted me to have the code stored on my computer, which would mean every time someone accessed my Episode Graph website it would go to my computer to run the code. My previous two projects, Your Vibe Code Guide to the Olympics and Your Vibe Code Guide to World Geography, both had static data, so no outside information was required. This project, however, would require going and looking at data that would constantly be updated (new TV episodes and movies come out every day).
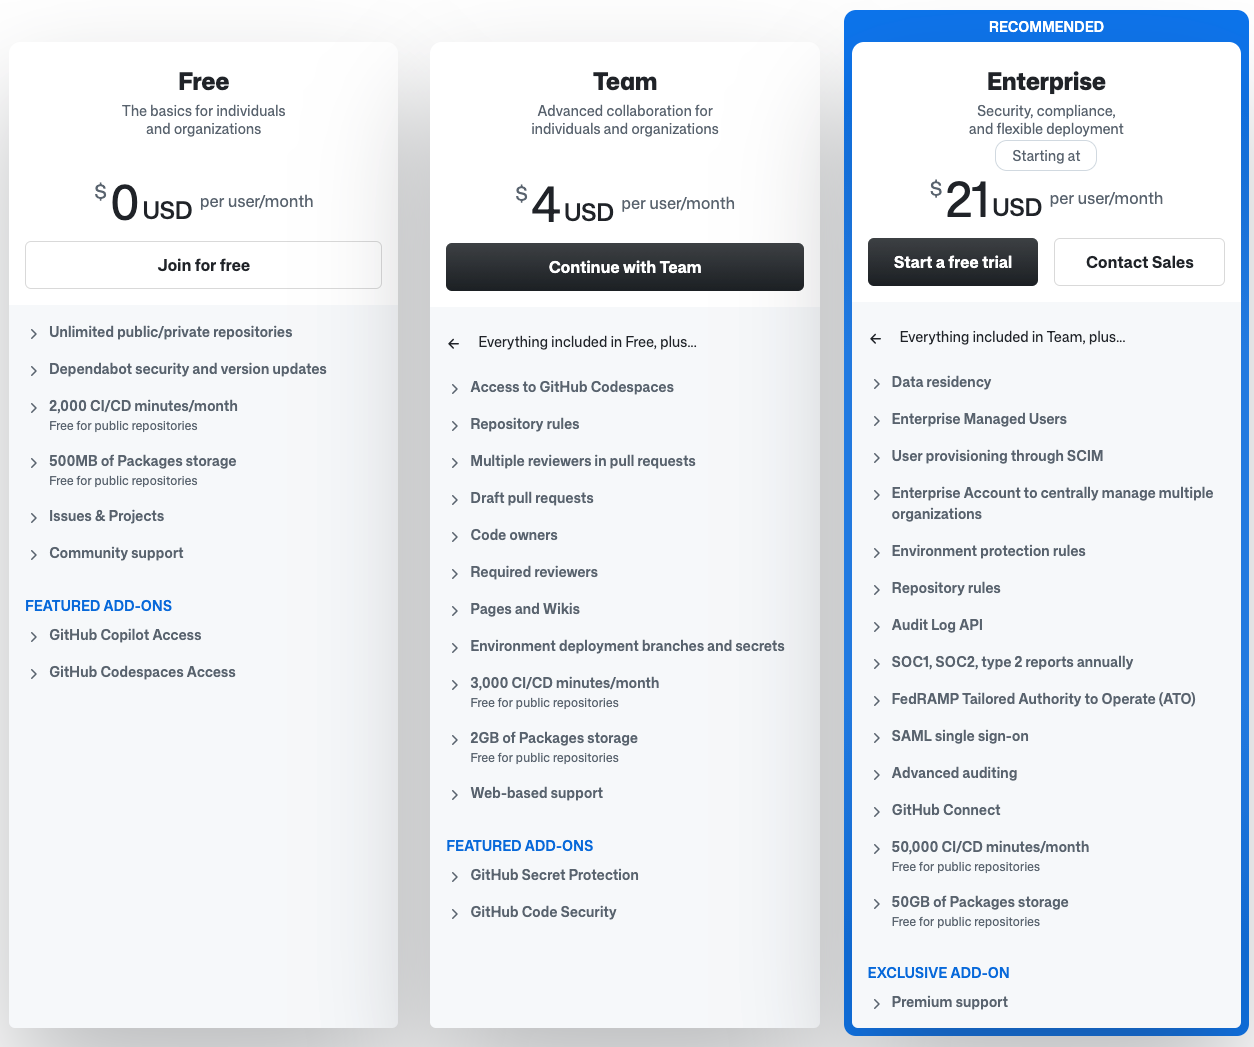
I am not a fan of running a website from my computer, so Codex told me that Github is a good alternative. And, that it is—especially since it offers a free option for my limited use. There are also paid options depending on your needs:
So, with that background, off I went. I had never used APIs or Github before, so I asked Codex to walk me through every step of signing up, and uploading code.
Though this all may sound complicated, it actually wasn’t. I did this all one night sitting on the couch watching another episode of The Lincoln Lawyer—which, as an aside, is a great series, both as TV and in book form (and so is the semi-related Bosch series)!
Within a couple of hours, I had a fully functioning site.
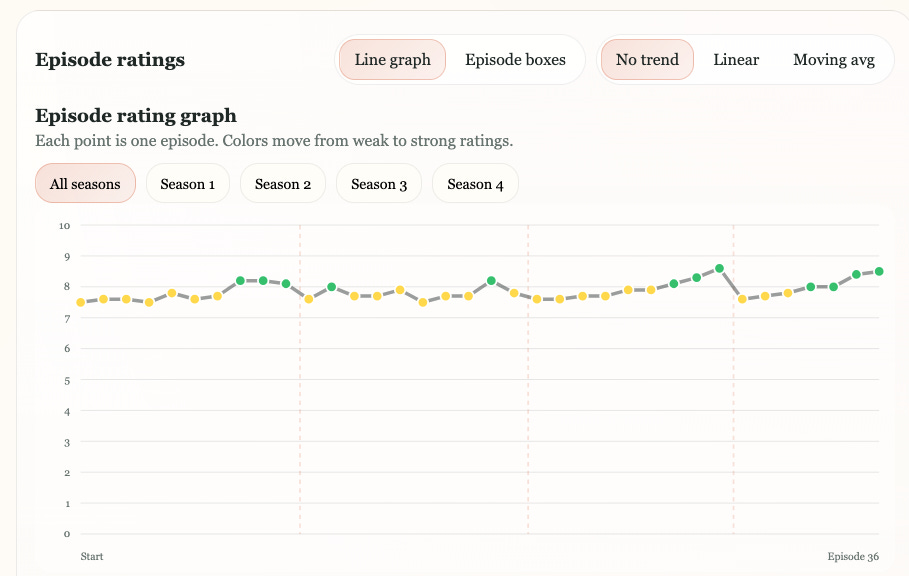
It started out with a basic line graph:
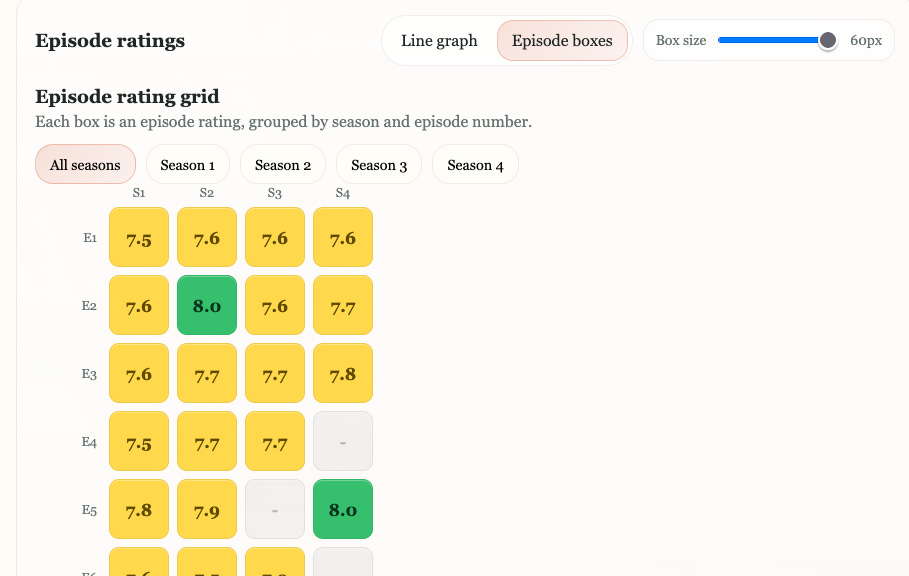
But I wanted the option for boxes, so I went back into Codex, told it what I wanted (along with an image from the Series Graph website), and within a couple of minutes it gave me new files to upload to Github.
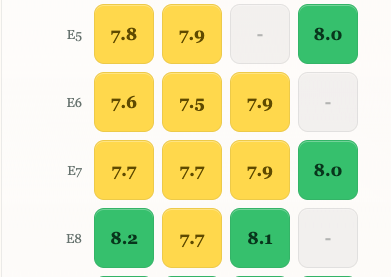
Once that loaded, I wasn’t happy with the large size of the boxes, so I asked it to make a slider tool enabling the user to make the box sizes as large or small as they wanted:
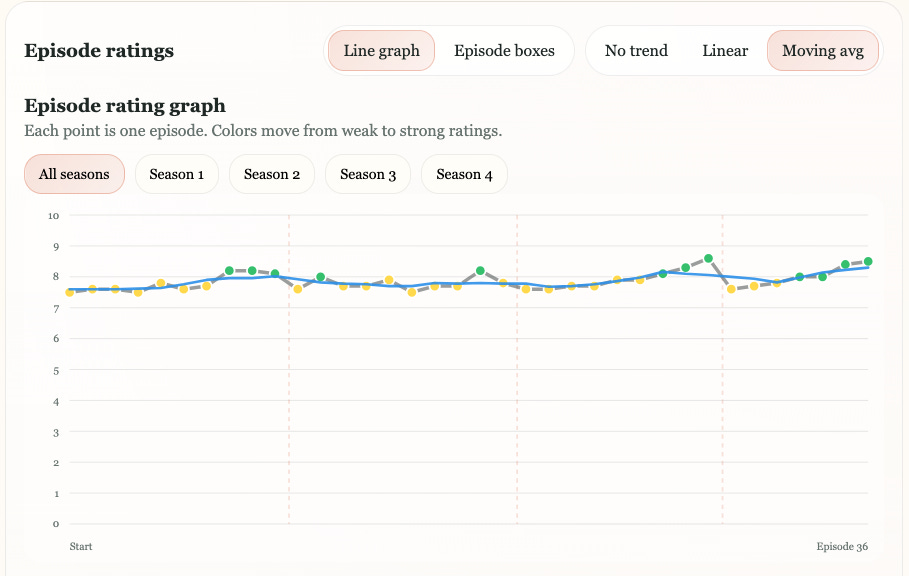
Note that you can choose between boxes or a line graph—it kept both options. From there, I asked Codex to provide “average” lines on the line graph. It wrote new code to show linear average, moving average, or no trend line at all, then I uploaded the new code to Github.
You might also notice that when you type a movie or TV show title in the search bar that the left panel of the site shows a list of all possible movies or shows with that title that you can choose from. I did not choose this option, Codex put it there in the initial version.
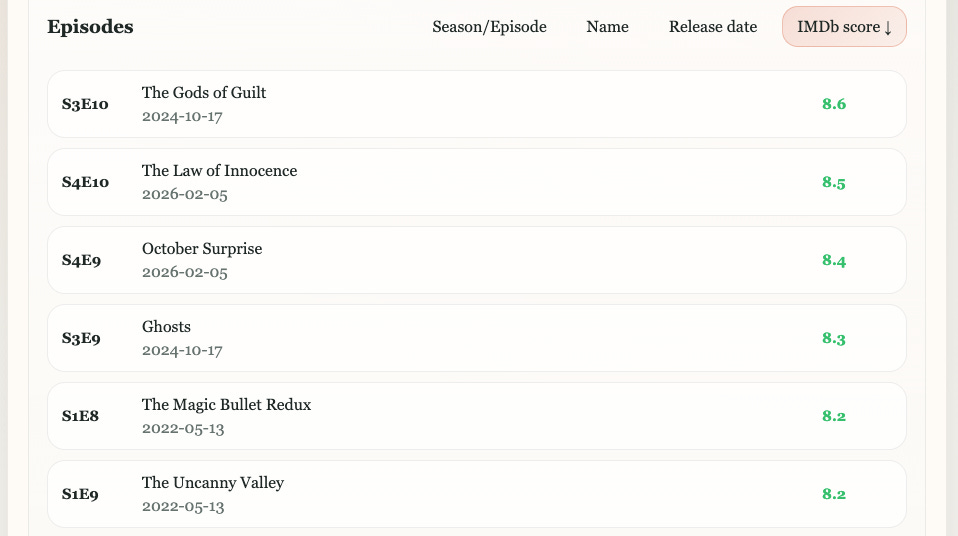
The information at the top and the sortable list at the bottom of the page were all created on the first iteration of the site by Codex as well…I didn’t even have to ask for them either.
However, this is where things started to get hard.
I wanted a button to toggle between light mode and dark mode, so Codex built that functionality in via a moon/asterisk button to the right of the search bar.

But, dark mode is horrendous:
I played around with Codex for quite a while trying to fix this issue, but eventually gave up because it was taking too long.
Also, it was around this time that I realized that some episode ratings were missing and I couldn’t figure out why.
I queried numerous other TV series in my new app and inevitably certain episode ratings would be missing from those also. For the next few nights, I worked for hours with Codex to try and diagnose and fix the problem. Ultimately, what I narrowed it down to (I think) is that the $1/month OMDb API does not give me all TV and movie information; if I want all TV and movie information, I’d have to pay $150K per year to IMDB for their API.
So, there my imperfect site sits.
I think what strikes me as most interesting about these projects is how easy they are to code with no coding experience. Some of these websites or apps, like Series Graph, are popular because of how they’ve coded their site to display information or be interactive. If I, as a novice, can take a screenshot of cleverly done website and just ask Codex to make it for me, then where does the competitive advantage lie? Are site designs considered Intellectual Property? If all the information on the internet is available for vacuuming up and repackaging, where’s the limit?
As a coda to this post, while doing some research for a Global Hot Spots (areas of conflict in the world) course that I’m developing, I came across a site that looks very much like it was developed with the help of AI—World Factbook Archive—which is designed to be a replacement for the now-defunct CIA Factbook. The website, though glitchy at times, has suspiciously similar components to some of the coding projects I’ve had Claude do for me. I’ll admit, though, the website is well done with lots of great graphics and interactive tools. The interesting part of it is that all of the past CIA Factbook data was uploaded to GitHub, and since it’s static and no longer being updated, anyone could create a similar website without using an API.