

👋 Hello Reader,
I didn’t originally intend to send out a mid-week newsletter, but there’s been much in the news about the economy lately, and in lieu of a larger Saturday issue, I’ve combined much of it for this newsletter.
If I have any recommendations for you (which I hesitate to do because I am not a licensed financial counselor), it would be:
Keep your expenses below in your income. It’s trite, but man, it does wonders for your bank account.
Don’t get caught up in the day-to-day ups and downs of the stock market; instead, focus on a long-term horizon.
Now may be the time to put some money in a high-yield savings account, if you’re able. You can find rates over 4% APR.
Of note, if you want to determine what that equates to in terms of return, then take the rate, divide it by 12 (there are 12 months in the year…i.e. APR), then multiply that by the amount you deposit in the account.
Ex: (4% / 12) x $1,000 = $3 per month in interest.
Here are some articles and charts that stood out to me:
THE QUICK SHOT 🚀

A lock icon (🔒) indicates articles behind a paywall, and a chart icon (📊) indicates an informative chart/graphic in “Slow Brew.”
The Stock Market
Stock Traders’ Risk Appetite Faces Great Reset (Bloomberg🔒)
Bond Selloff Threatens Hopes for Economy’s Soft Landing (WSJ🔒) 📊
Global bond rout deepens (Reuters)
Yield Curve (Long Term Trends) 📊
Inverted Yield Curve: Definition, What It Can Tell Investors, and Examples (Investopedia)
A New Interest-Rate Regime Has Begun. These Are the Market’s Winners and Losers. (WSJ🔒) 📊
Bonds vs. Stocks: A Beginner’s Guide (Nerd Wallet)
Stocks in the S&P 500 (Slick Charts) 📊
US National Debt
US Debt balance (Trading Economics) 📊
What is the national debt? (Treasury) 📊
US Interest Payments (St Louis Fed) 📊
Who owns the US National Debt (The Balance Money) 📊
US Budget
How much has the U.S. government spent this year? (Treasury) 📊
Policy Basics: Where Do Our Federal Tax Dollars Go? (CBPP) 📊
Consumer Spending & Saving
Personal Savings Rate (St Louis Fed) 📊
Why Consumers Are Mad About Inflation Even Though It Has Fallen (WSJ🔒) 📊
Americans Are Still Spending Like There’s No Tomorrow (WSJ🔒) 📊
Credit card debt Balance (Trading Economics) 📊
Delinquencies rise for credit cards and auto loans, and it could get worse (WP🔒) 📊
Mortgage Rates Reach Highest Level in Almost 23 Years (Freddie Mac) 📊
Home loan delinquency rates (Trading Economics) 📊
THE SLOW BREW ☕

The Stock Market
Stock Traders’ Risk Appetite Faces Great Reset (Bloomberg🔒)
Autoworkers on strike. A looming government shutdown. Energy prices on a tear. One by one, fresh pressure points are building on Wall Street that threaten the bullish narrative that a soft economic landing can be secured in this menacing monetary era. All that just sparked the worst month for the S&P 500 of this gravity-defying year in markets. Put another way, the Federal Reserve’s restrictive monetary policy is tightening financial conditions by design. The two-month damage to stocks thanks to even higher longer-term bond yields — while the US dollar soars — has pushed a Goldman Sachs Group Inc. index of cross-asset health to the most sluggish level of the year.
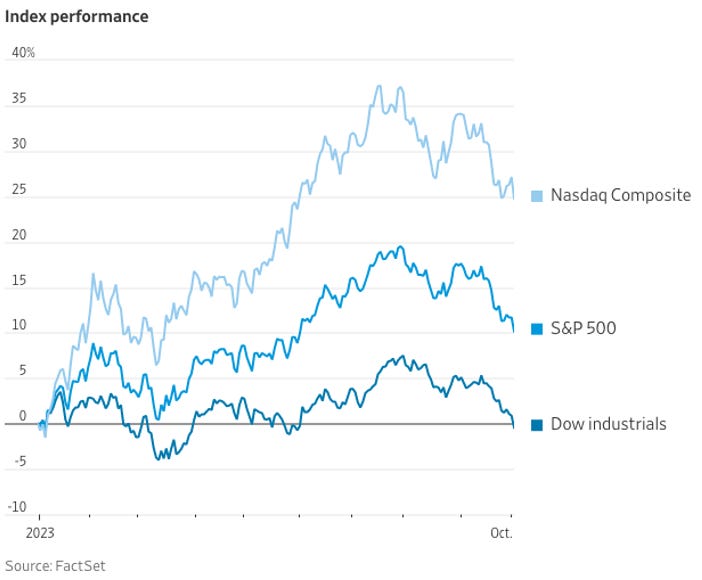
Bond Selloff Threatens Hopes for Economy’s Soft Landing (WSJ🔒)
A sudden surge in long-term interest rates to 16-year highs is threatening hopes for an economic soft landing, all the more because the exact triggers for the move are unclear. The Federal Reserve has been raising short-term rates for 1½ years. Those increases are designed to push up longer-term bond yields, combating inflation by slowing the economy. But the speed of the latest jump might be a case of “be careful what you wish for.” It comes as inflation has eased and the Fed has signaled it is nearly done lifting rates. The yields on the 10-year Treasury note rose 0.119 percentage point Tuesday to 4.801%, the highest level since the subprime mortgage crisis began in August 2007. On Wall Street, the Dow Industrials fell about 431 points, or 1.3%, giving up all their gains for the year. The S&P 500 declined 1.4%. The technology-heavy Nasdaq Composite dropped 1.9%. The lack of an obvious culprit for the latest rise in longer-dated yields suggests that the so-called term premium, or the extra yield that investors demand for investing in longer-dated assets, is rising. That would mark an abrupt reversal following the low-inflation, low-growth environment that prevailed between the 2008-09 financial crisis and the Covid-19 pandemic. A higher term premium means even if inflation is under control, borrowers will have to pay more than before because investors want extra compensation for the risks associated with locking up their money for longer periods. A sustained rise in Treasury yields will be costly for the U.S. government because it would face still-higher borrowing costs on a much larger stock of its debt. The publicly held debt of the U.S. has doubled to around $26 trillion over the past eight years. The run-up in borrowing costs is sending mortgage rates to 23-year highs, with more lenders now quoting rates above 7.5% for the 30-year fixed loan. Higher borrowing costs could weigh on stocks and other asset prices, leading to weaker investment, hiring and economic activity.
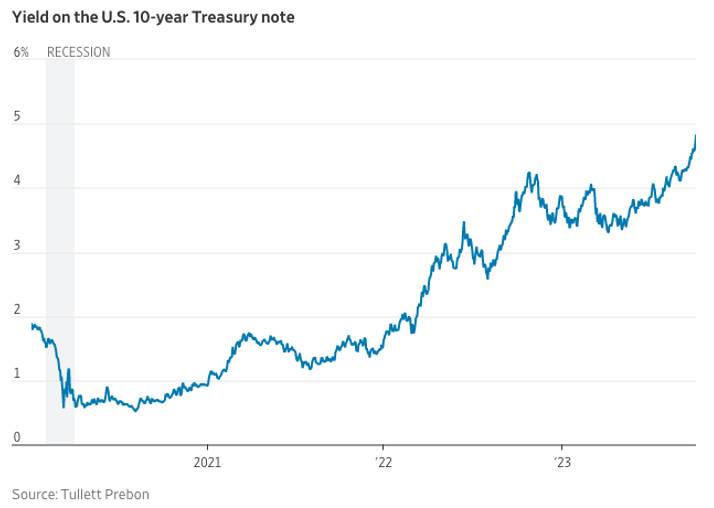
Global bond rout deepens (Reuters)
A rout in government bond markets deepened on Wednesday with U.S. yields reaching their highest in 16 years, souring appetite for riskier assets as investors bet that interest rates will remain persistently high, boding ill for the world economy. The U.S. Treasury 10-year yield rose 6.9 basis points (bps) to 4.872%, its highest since 2007, after climbing nearly a dozen bps on Tuesday's job openings data that pointed to resilience in the U.S. economy. Thirty-year Treasury yields rose above 5% for the first time since August 2007, just before the global financial crisis.
Yield Curve (Long Term Trends)
The difference b/t 10-yr yield and 1yr/2yr/3yr yield
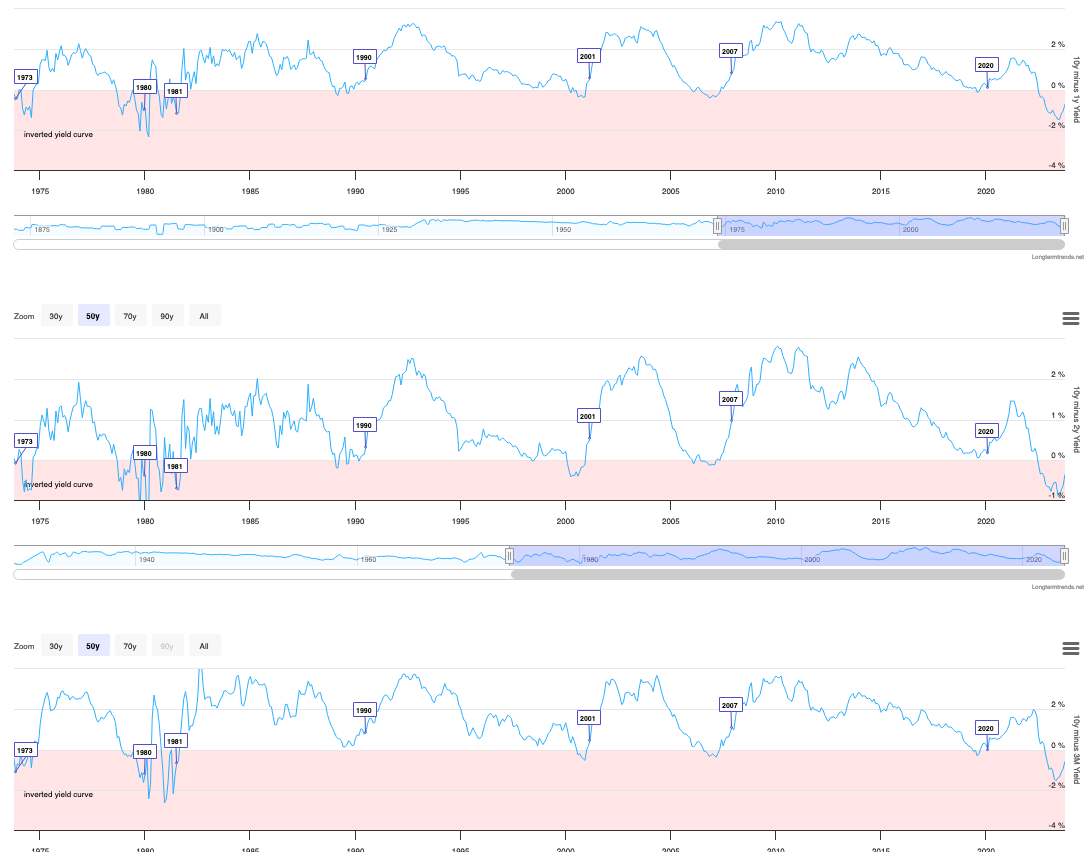
Inverted Yield Curve: Definition, What It Can Tell Investors, and Examples (Investopedia)
An inverted yield curve shows that long-term interest rates are less than short-term interest rates. With an inverted yield curve, the yield decreases the farther away the maturity date is. Sometimes referred to as a negative yield curve, the inverted curve has proven in the past to be a reliable indicator of a recession.
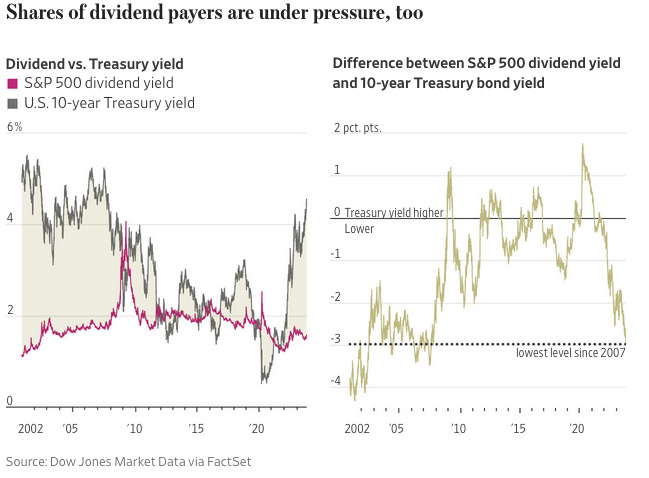
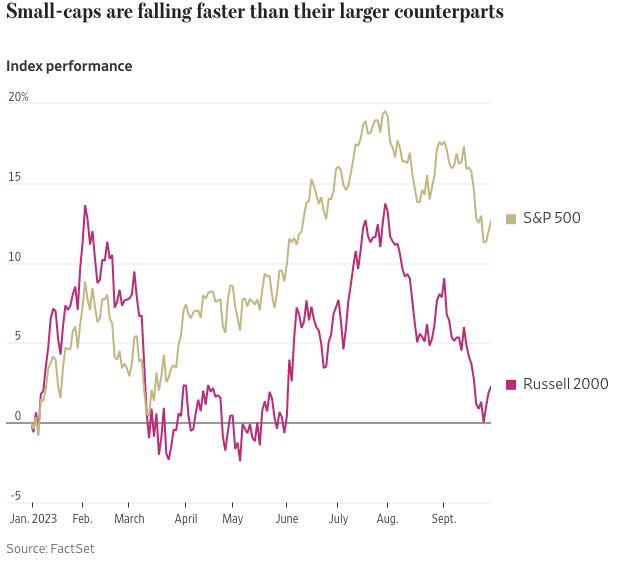
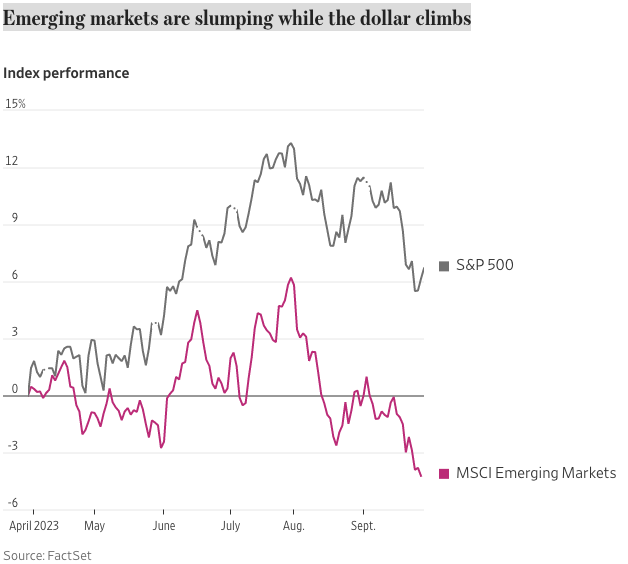
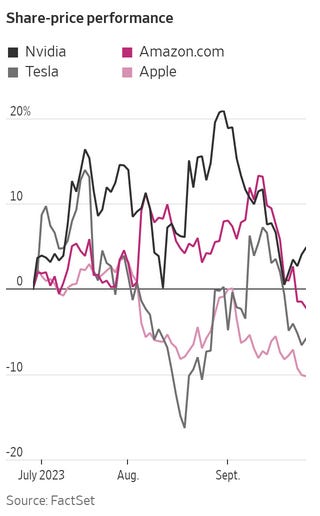
A New Interest-Rate Regime Has Begun. These Are the Market’s Winners and Losers. (WSJ🔒)
Investors are struggling to make peace with a new reality: Interest rates are likely to remain higher for longer. Stocks have tumbled, government-bond yields have risen and the U.S. dollar has climbed since Federal Reserve officials signaled two weeks ago that they might hold rates near current levels through 2024. Entering the fourth quarter, the S&P 500 is hanging on to a 12% advance for the year, but much of the enthusiasm that characterized markets in the first half has largely disappeared. Here’s how the new interest-rate regime is forcing money managers to adjust their investing playbooks. Bond prices are declining—again. The Magnificent Seven [big tech stocks] are losing their shine. Shares of dividend payers are under pressure, too. Small-caps are falling faster than their larger counterparts. Emerging markets are slumping while the dollar climbs.
Bonds vs. Stocks: A Beginner’s Guide (Nerd Wallet)
You've probably heard of stocks and bonds — but do you know the difference between them? These two investment types can both play important roles in a portfolio — but they work in very distinct ways.
Dow’s 2023 Gains Are Wiped Out as Bond Yields Rise (WSJ🔒)
An intensifying bond selloff sparked new losses on Wall Street on Tuesday, wiping out what was left of the Dow Jones Industrial Average’s gain for the year and pushing the yields on U.S. Treasurys to fresh multiyear highs. The losses were broad, with risky technology firms, rate-sensitive banks and real-estate owners and companies that rely on discretionary spending leading the way lower. Utility shares were the only industry segment in the S&P 500 to rise. They added 1.2%, bouncing off big losses Monday. Meanwhile, the yield on the 10-year Treasury note exceeded 4.8% for the first time since August 2007, ending Tuesday at 4.801%. The two-year note yield rose to 5.148% and the payout on 30-year bonds hit 4.936%. Besides luring yield-seeking investors away from dividend-paying stocks, Treasury yields that are so comfortably above the rate of inflation—so-called real yields—are likely to weigh heavily on companies’ results and pressure their shares, said Mabrouk Chetouane, head of global market strategy at Natixis Investment Managers. Investors around the world are hoarding cash, which is paying around 5.5% in money-market funds and via short-term Treasury bills. Even well-known bond trader and DoubleLine Chief Executive Jeffrey Gundlach advocated a strategy of “T-Bill and Chill” at the Grant’s investment conference in New York on Tuesday.
Stocks in the S&P 500 (Slick Charts)
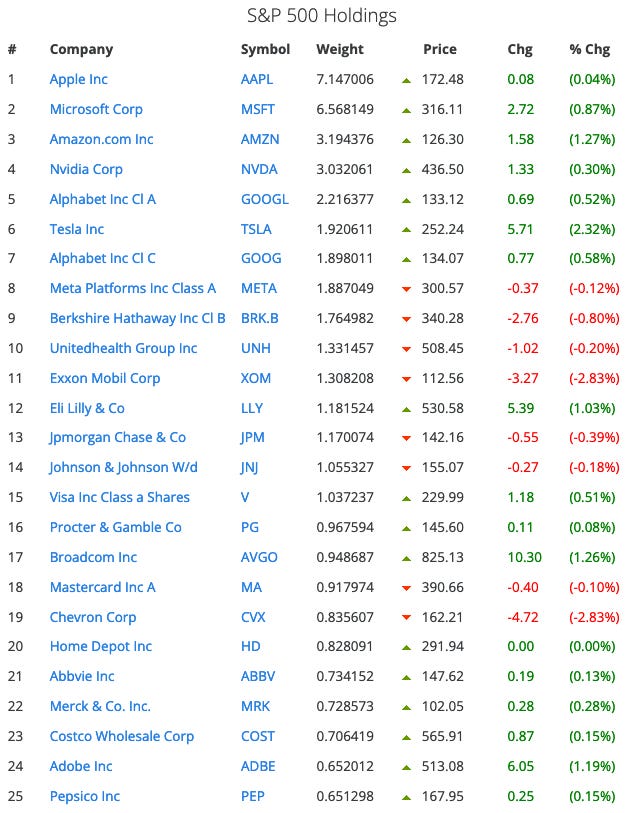
Note that the top 10 stocks make up 30% of S&P by value; the top 25 stocks make up 44%, and the top 50 make up 56%….which highlights the need to diversify.
US National Debt
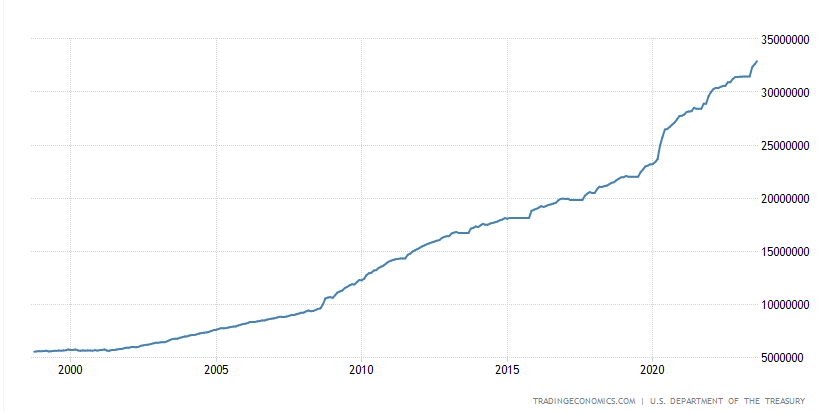
US Debt balance (Trading Economics)
Government Debt in the United States increased to 32,914,149 USD Million in August from 32,608,585 USD Million in July of 2023.
What is the national debt? (Treasury)
The national debt ($33.44 T) is the total amount of outstanding borrowing by the U.S. Federal Government accumulated over the nation’s history. The national debt is composed of distinct types of debt, similar to an individual whose debt may consist of a mortgage, car loan, and credit cards. The different types of debt include non-marketable or marketable securities and whether it is debt held by the public or debt held by the government itself (known as intragovernmental). Simply put, the national debt is similar to a person using a credit card for purchases and not paying off the full balance each month. The cost of purchases exceeding the amount paid off represents a deficit, while accumulated deficits over time represents a person’s overall debt.
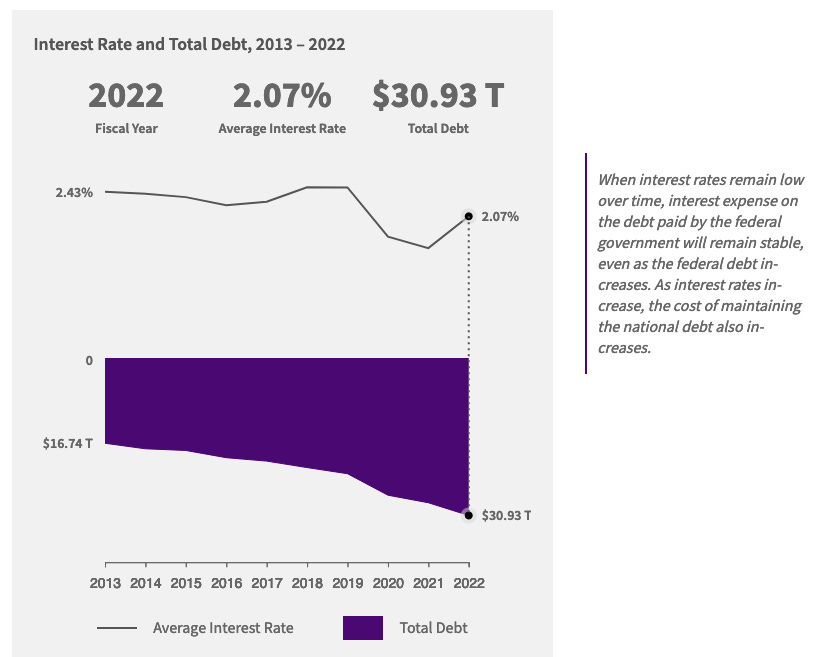
I think it’s really important to read that note to the right of the chart, especially in light of current interest rates.
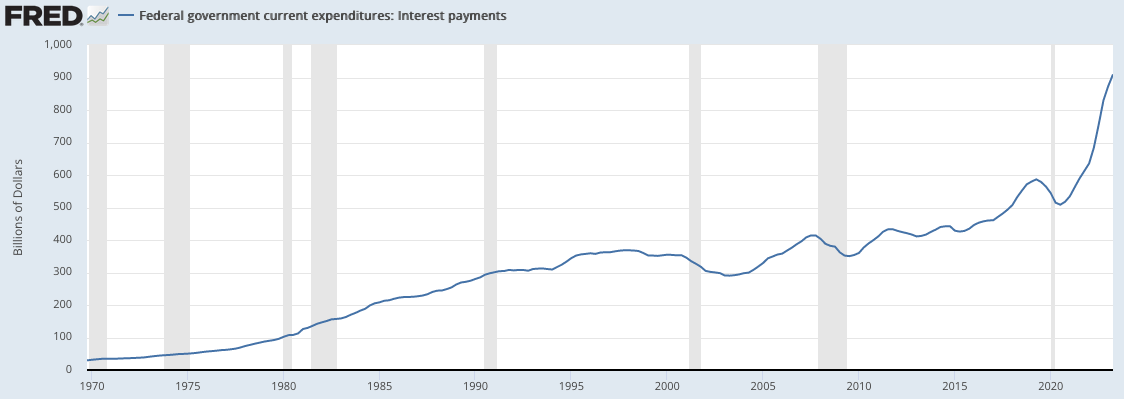
US Interest Payments (St Louis Fed)
Who owns the US National Debt (The Balance Money)
There are two kinds of national debt: intragovernmental and public. Intragovernmental is debt held by the Federal Reserve and Social Security and other government agencies. Public debt is held by the public: individual investors, institutions, foreign governments. After intragovernmental holdings, the next largest category is national debt held by foreign governments. Of those, Japan has the most, followed by China. The Federal Reserve also invests in U.S. national debt as it added liquidity to the economy during and after the Great Recession, and more recently during the pandemic.
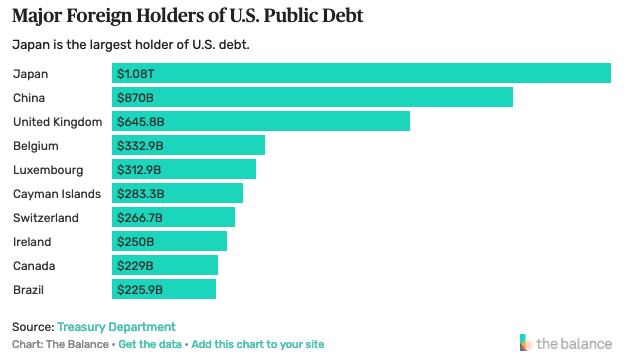
Information above as of Jan 2023.
US Budget
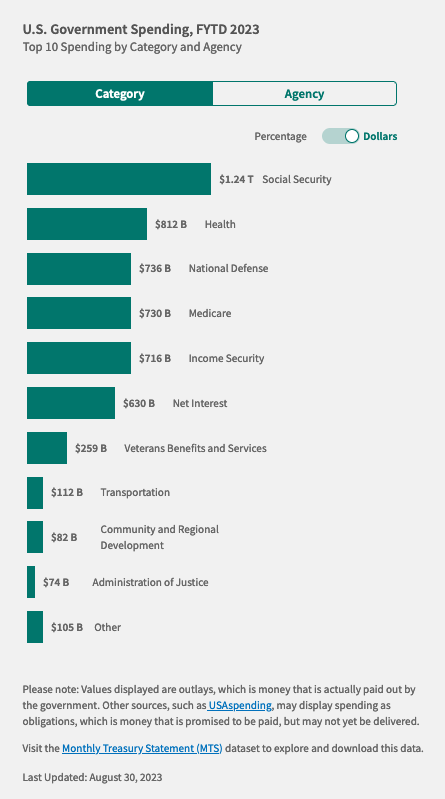
How much has the U.S. government spent this year? (Treasury)
The U.S. government has spent $5.50 trillion in fiscal year 2023 to ensure the well-being of the people of the United States. The federal government spends money on a variety of goods, programs, and services that support the economy and people of the United States. The federal government also spends money on the interest it has incurred on outstanding federal debt. Consequently, as the debt grows, the spending on interest expense also generally grows
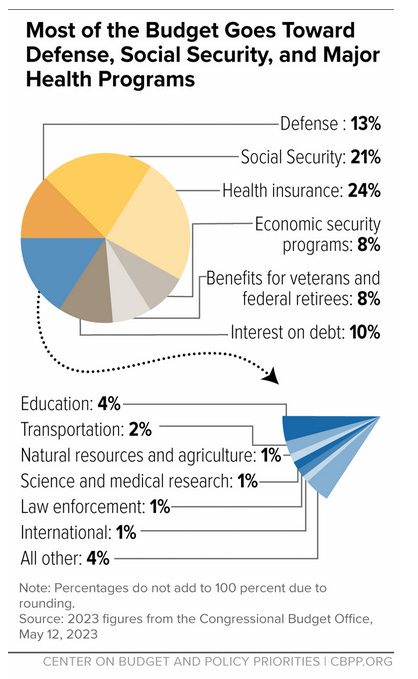
Policy Basics: Where Do Our Federal Tax Dollars Go? (CBPP)
The federal government collects taxes to finance various public services. As policymakers and citizens weigh key decisions about revenues and expenditures, it is important to examine what the government does with the money it collects.
Consumer Spending & Saving
Personal Savings Rate (St Louis Fed)
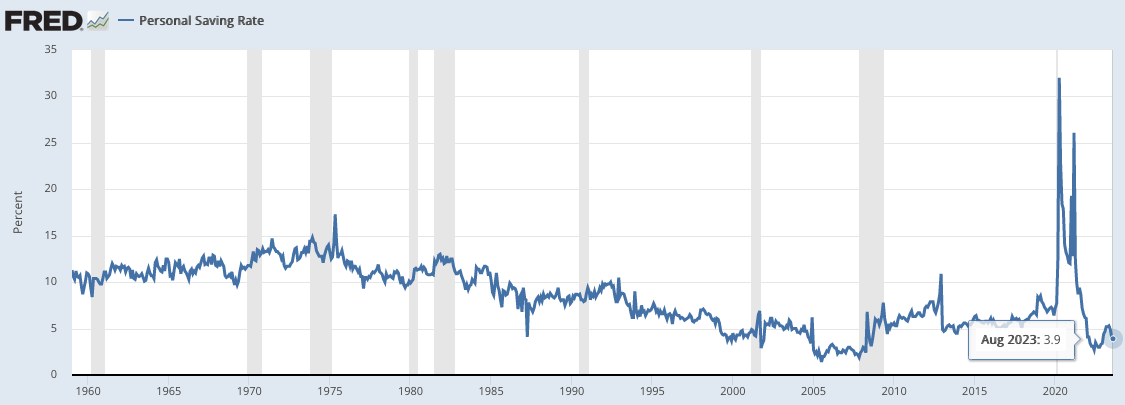
The current personal savings rate in the US is falling (that’s not good). It was 3.9% in August 2023.
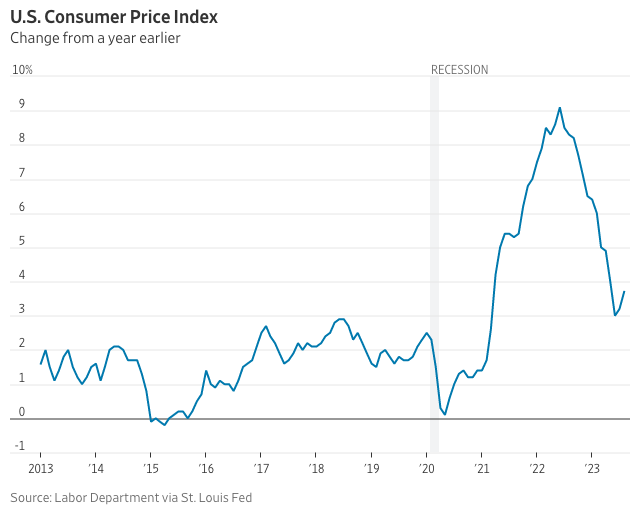
Why Consumers Are Mad About Inflation Even Though It Has Fallen (WSJ🔒)
Inflation has fallen sharply in the past year. The economy remains strong. Yet Americans remain deeply unhappy about the economy, often citing inflation. One big reason: While economists and the Federal Reserve focus on inflation, which is the rate of change in prices, Americans in their everyday lives usually focus on the absolute price of the things they need and want.
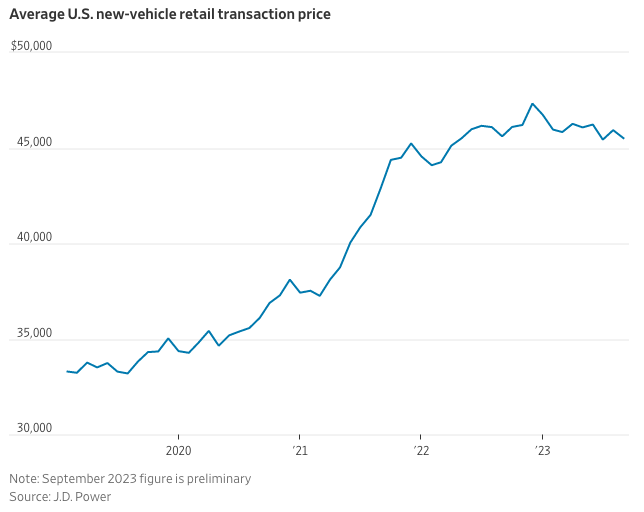
Americans Are Still Spending Like There’s No Tomorrow (WSJ🔒)
Consumers should be spending less by now. Interest rates are up. Inflation remains high. Pandemic savings have shrunk. And the labor market is cooling. Yet household spending, the primary driver of the nation’s economic growth, remains robust. Americans spent 5.8% more in August than a year earlier, well outstripping less than 4% inflation. And the experience economy boomed this summer, with Delta Air Lines reporting record revenue in the second quarter and Ticketmaster selling over 295 million event tickets in the first six months of 2023, up nearly 18% year-over-year. Economists and financial advisers say consumers putting short-term needs and goals above long-term ones is normal. Still, this moment is different, they say. A tough housing market has more consumers writing off something they’d historically save for, while the pandemic showed the instability of any long-term plans related to health, work or day-to-day life. So, they are spending on once-in-a-lifetime experiences because they worry they may not be able to do them later.
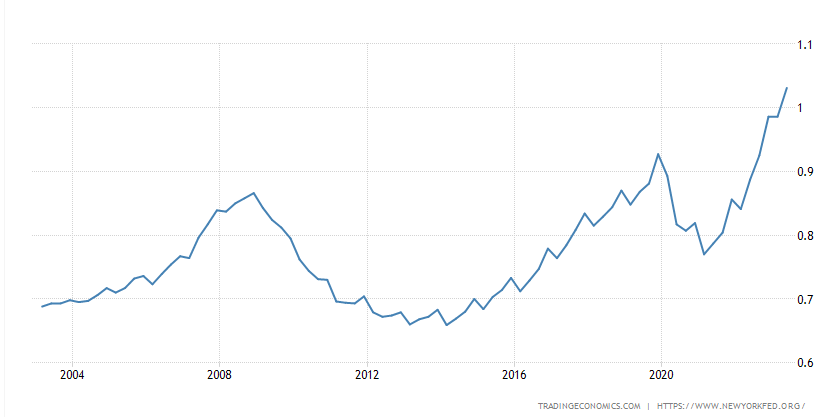
Credit card debt Balance (Trading Economics)
Debt Balance Credit Cards in the United States increased to 1.03 Trillion USD in the second quarter of 2023 from 0.99 Trillion USD in the first quarter of 2023.
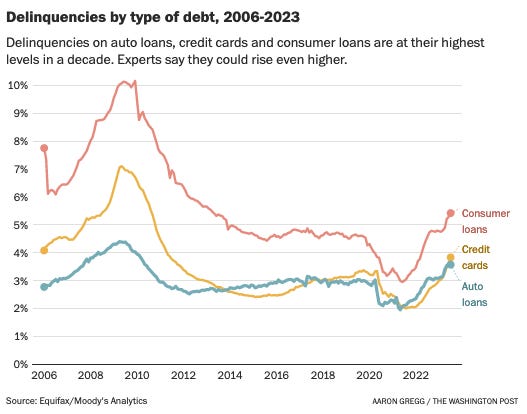
Delinquencies rise for credit cards and auto loans, and it could get worse (WP🔒)
More Americans are falling behind on their car loan and credit card payments than at any time in more than a decade, a troubling signal of consumer stress as higher prices and rising borrowing costs are squeezing household budgets.
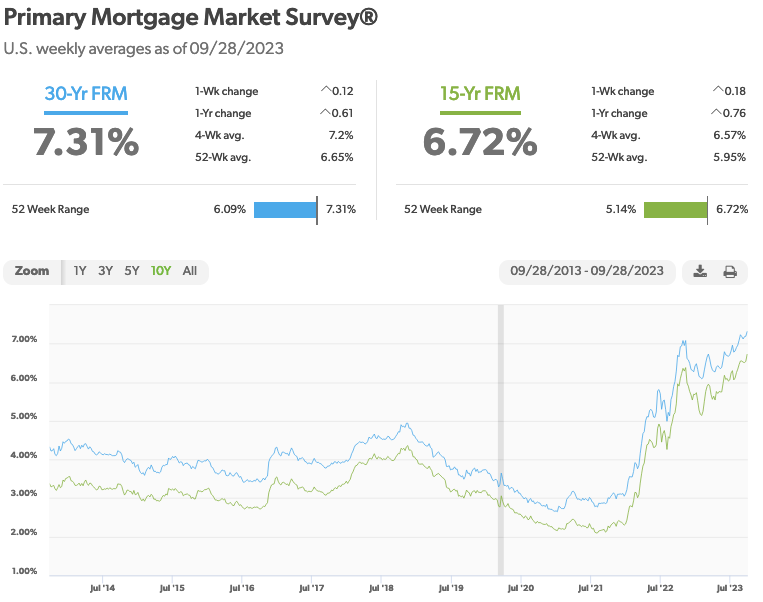
Mortgage Rates Reach Highest Level in Almost 23 Years (Freddie Mac)
The 30-year fixed-rate mortgage has hit the highest level since the year 2000. However, unlike the turn of the millennium, house prices today are rising alongside mortgage rates, primarily due to low inventory. These headwinds are causing both buyers and sellers to hold out for better circumstances.
Home loan delinquency rates (Trading Economics)
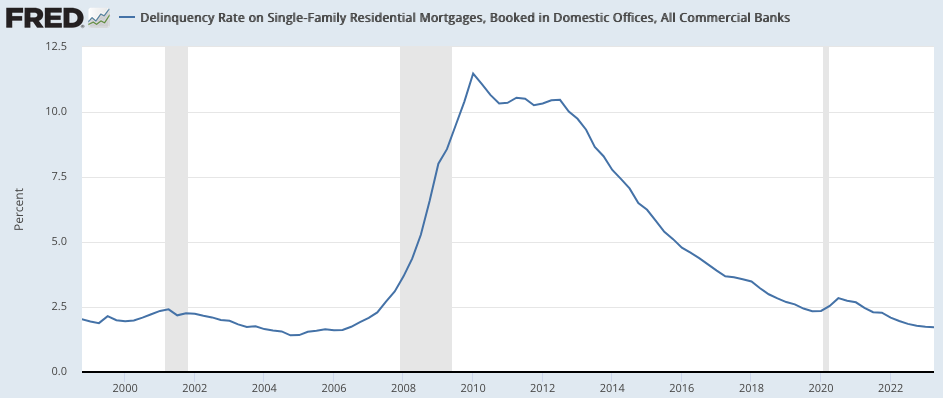
The delinquency rate for second quarter 2023 was 1.72%…glad to see it staying low.
So, this is where I’d give you a bunch of financial advice…but since I’m not certified to do so, I wont…